1. Installation and Activation
I cannot find the location of the installer on the website.
You need to create an account first by signing up. Once you log in, you will see the download link at the
top panel.

I cannot find the software after the installation.
It is a Microsoft Excel Addin. So, once you open a new Excel file, you will see the Addin in the Ribbon.

I cannot find the Addin in the MS Excel ribbon.
If you have installed the Addin for the first time, please close all of the open MS Excel applications. Then, open an Excel file. You should be able to see the Addin now. However, if the problem persists, there are two possible reasons.
• MS Excel has hidden the Insights-AI Add-in
• MS Excel has disabled the Insights-AI Add-in
Unhiding Insights-AI Add-in
To unhide the Insights-AI Addin, please follow the steps listed below.
Go to FILE menu >> Options >> Customize Ribbon >> Main Tabs >> Check ‘Developer’
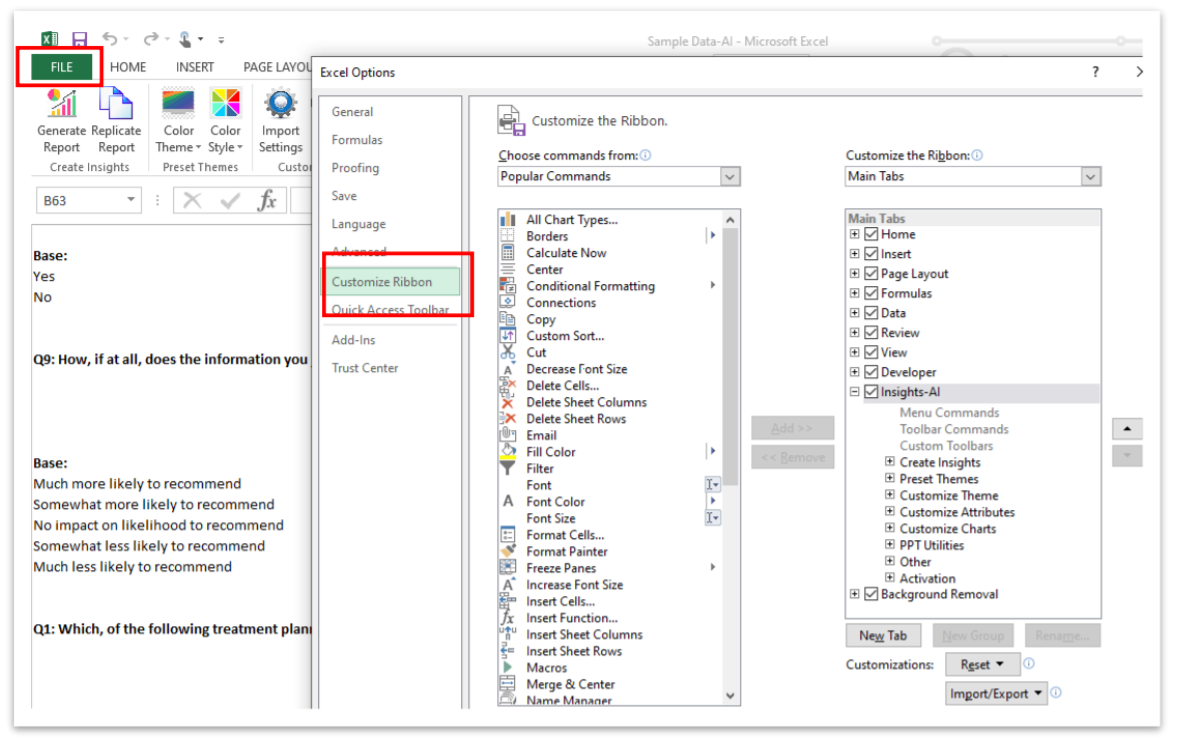
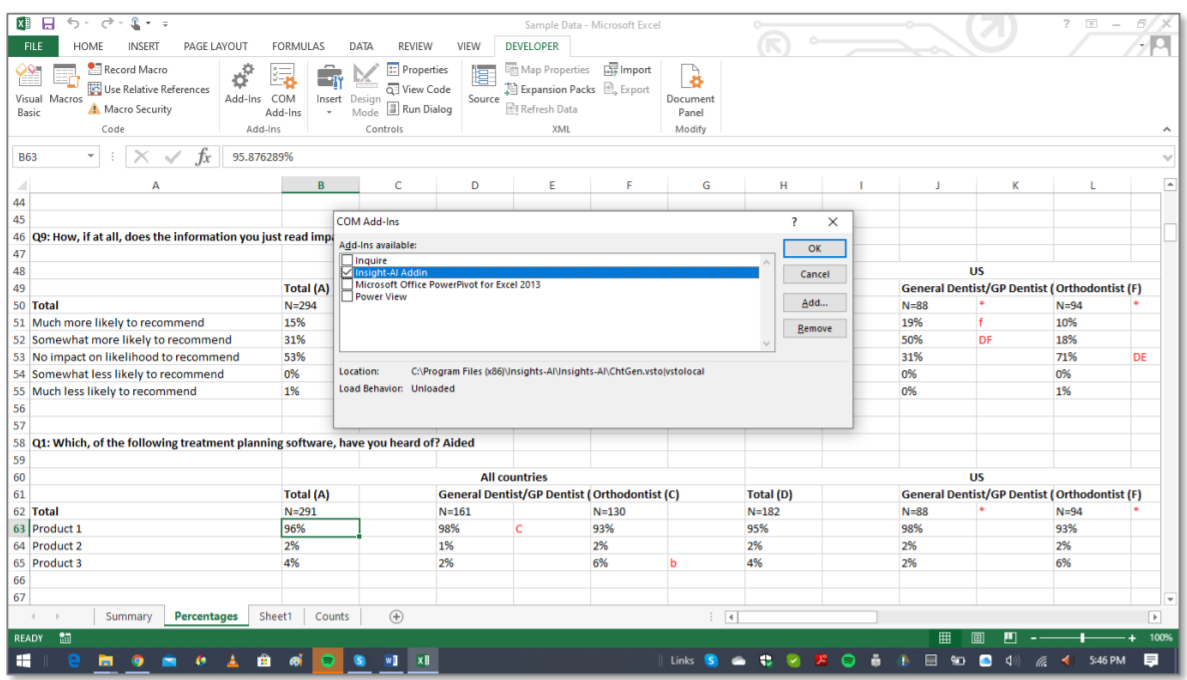
Click ‘Ok.’ The ‘Developer’ tab will appear on the Ribbon. Then click on the ‘Developer’ tab. Next, click on ‘Com Addins.’

In the end, check the ‘Insights-AI Addin’ to show it on the Excel ribbon.
Enabling Insights-AI Add-in
If you are still not able to see the Insights-AI Addin in the COM Addin section, MS Excel might have disabled it. Please follow these steps to enable it.
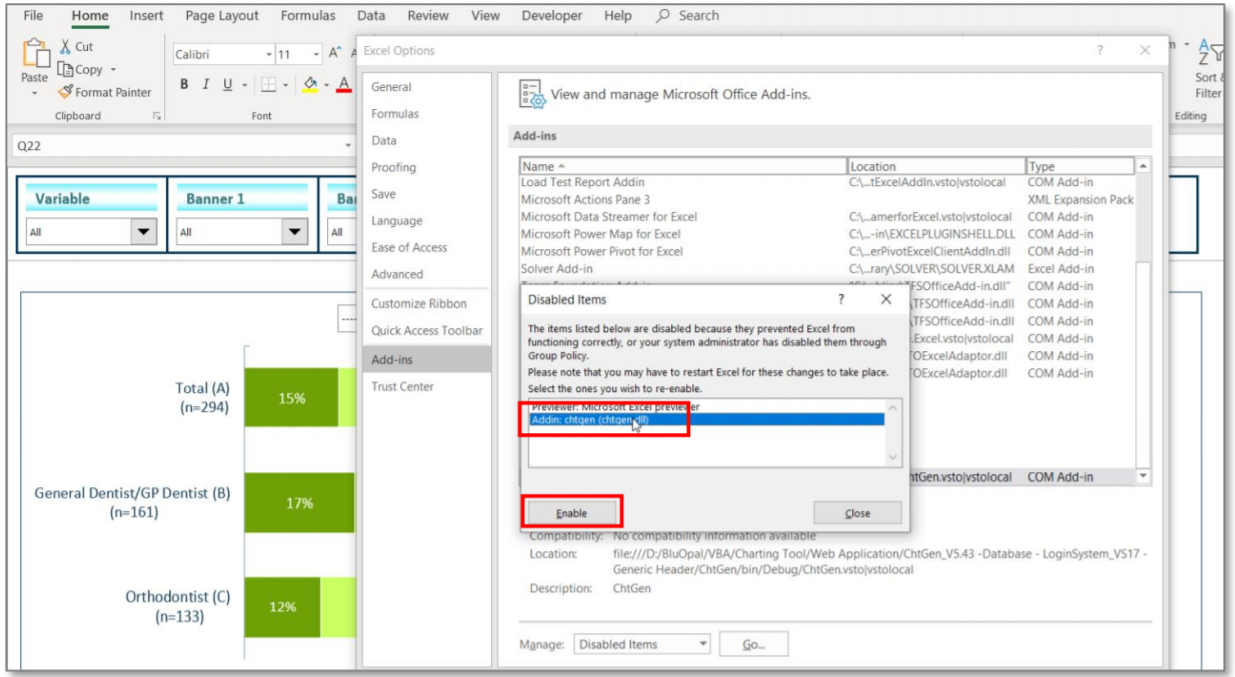
Go to FILE menu >> Options >> Add-ins >>Manage>> Disabled Items>>Go
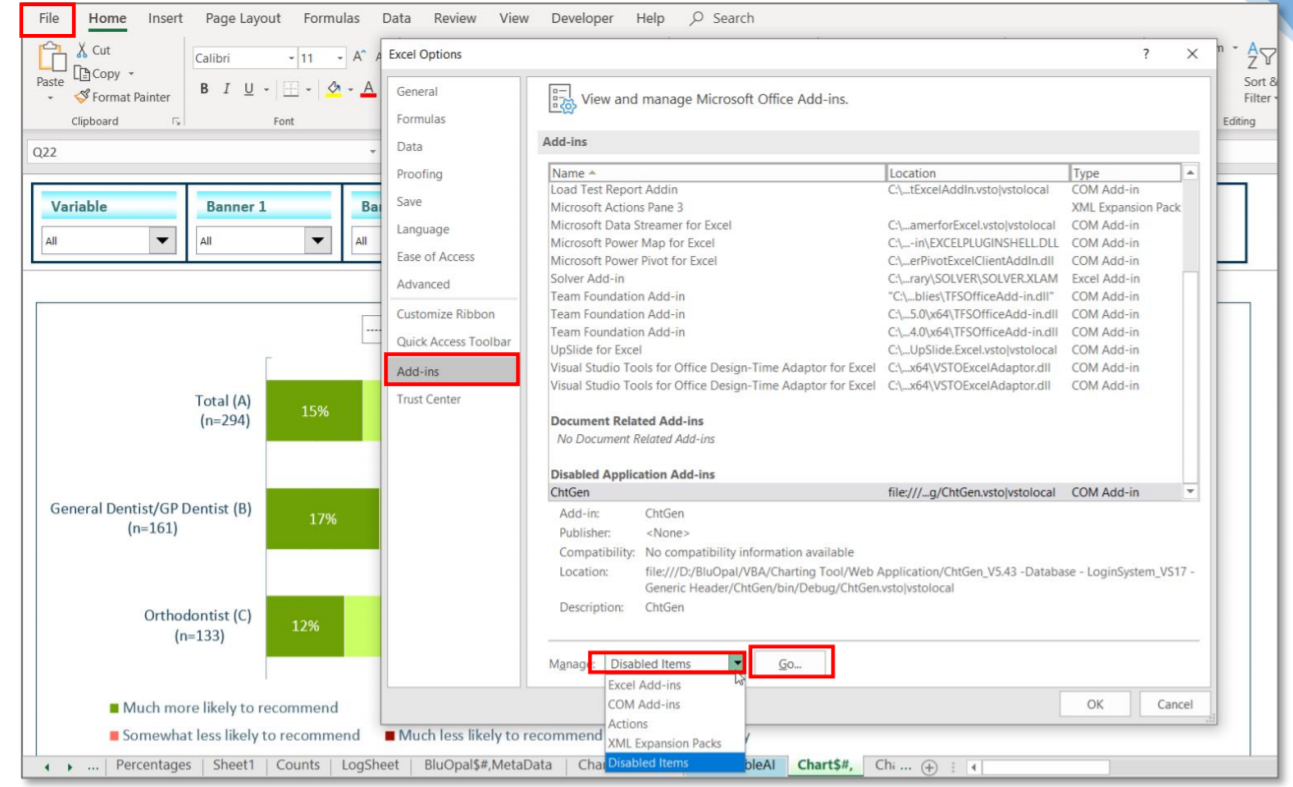
Once you click on ‘Go,’ the application shows you the list of the disabled Addins. Please select ‘Insights-AI’ and click ‘Enable’ to enable it.
I can see the Addin in the MS Excel ribbon, but I cannot click on the “Generate” button.
You would need to activate the application after the installation to be able to use the tool. Please consult the manual for information on how to activate the tool.

I am not able to activate the application on another computer.
The license issued for the application is a single-device license. Hence at one time, you can install the application at only one computer.
To install it on another computer, you need to deactivate the application first on the original computer. You can do this in two ways –
i. Deactivate on the computer
ii. Deactivate online
Deactivate on the computer
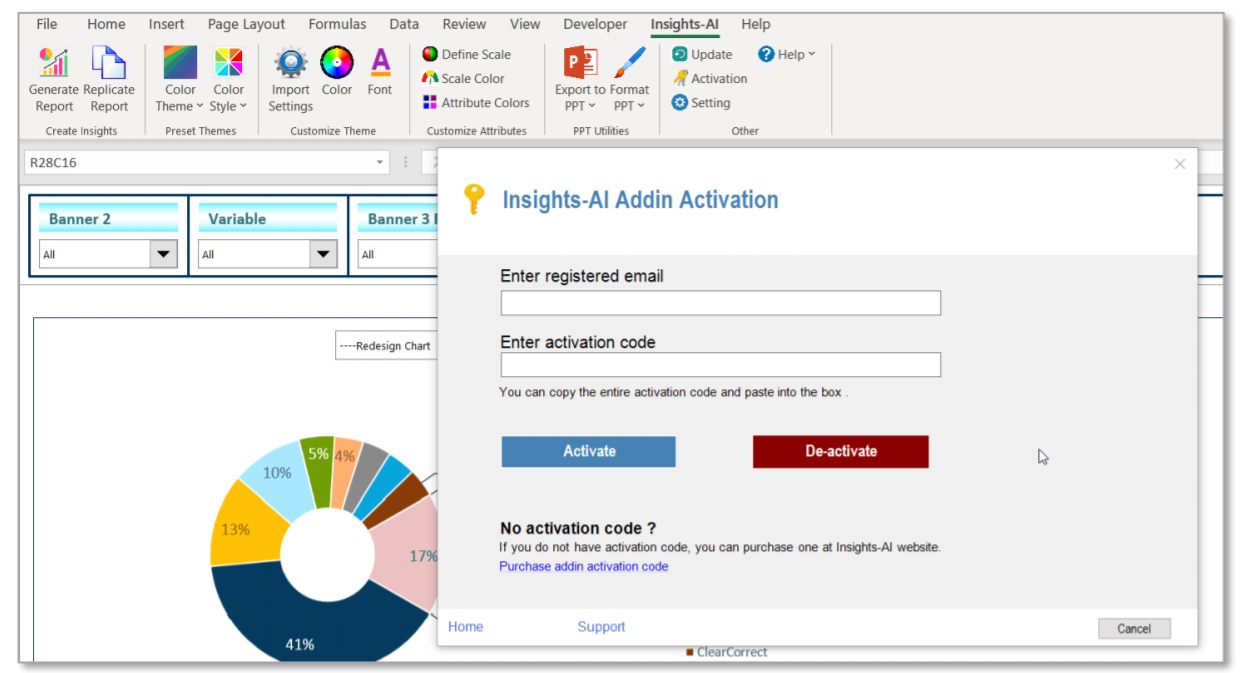
First, click on the activation button.

Then, click on the Deactivate button, and it will deactivate the application from the system.
Deactivate online
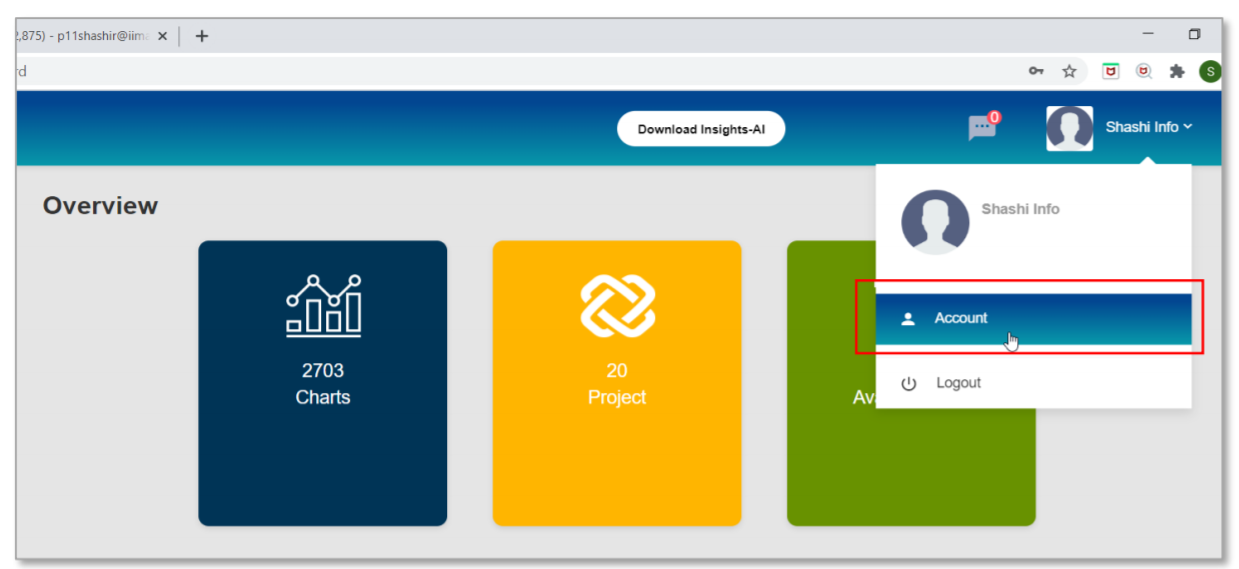
First, log in to your account and go to the “Account” section.
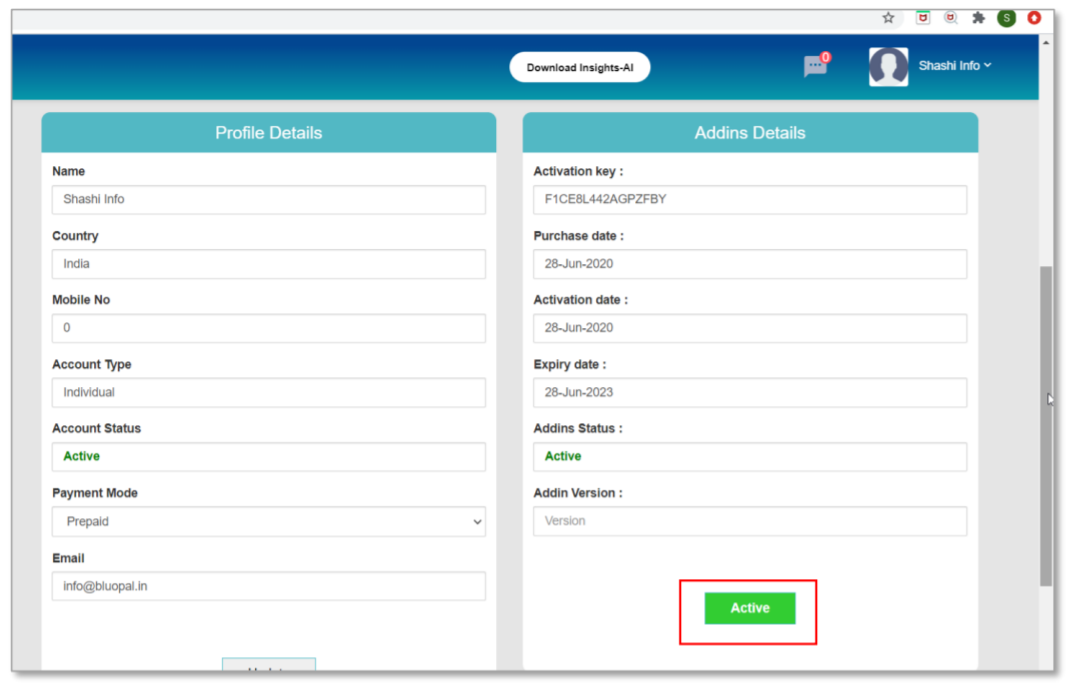
Then, scroll down to the “Addin Details” section. You will see a green “Active” button at the bottom. Please click it to toggle it to Deactivate mode.
2. Creating New Users in Corporate Account
How can I create a new corporate account? I cannot see this option online.
Insights-AI provides some benefits to corporate users over personal users like monthly billing for corporates compared to upfront payment for personal users. Hence we conduct necessary checks to verify a corporate customer.
Hence you need to contact us in order to create a new corporate account. You will get the registration email after the verification.
I am a corporate administrator. How do I add new users?
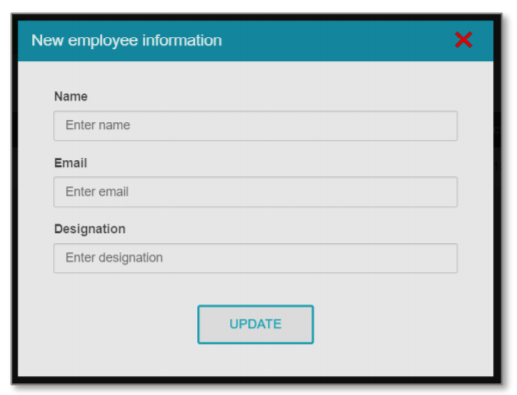
A corporate administrator can add new users by clicking on the ADD NEW USER button.

A pop-up menu will guide the administrator to add a few details to facilitate the new user creation.
3. Creating Charts & Reports
I can see the Addin in the MS Excel ribbon, but I cannot click on the “Generate” button.
You need to activate the application after installation to use the tool. Please consult the manual for information on how to activate the tool.

How can I stop the report generation process?
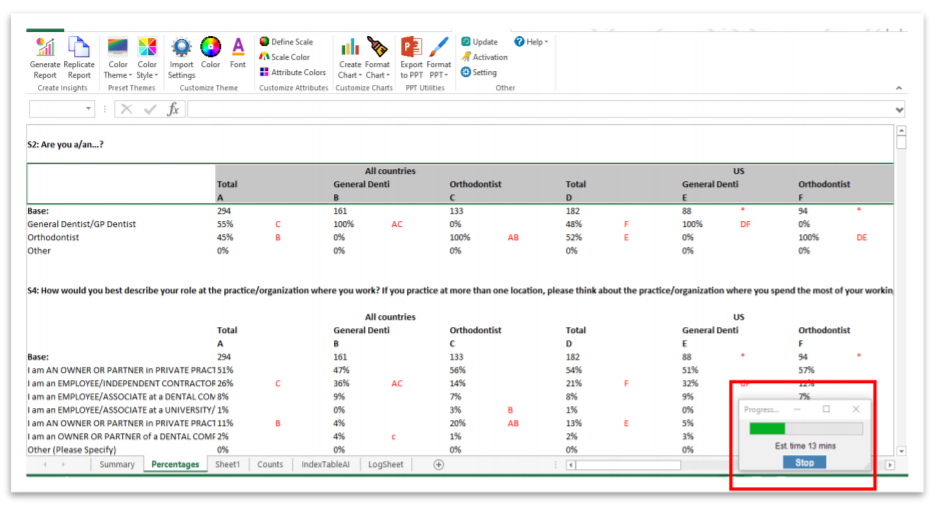
When the application is generating the report, a small ‘Dashboard’ is displayed on the bottom right corner that shows the estimated time and status of the report generation process. You can click on the “Stop” button to stop the report generation process.
How can I analyze one table and customize the charts that correspond to that table?
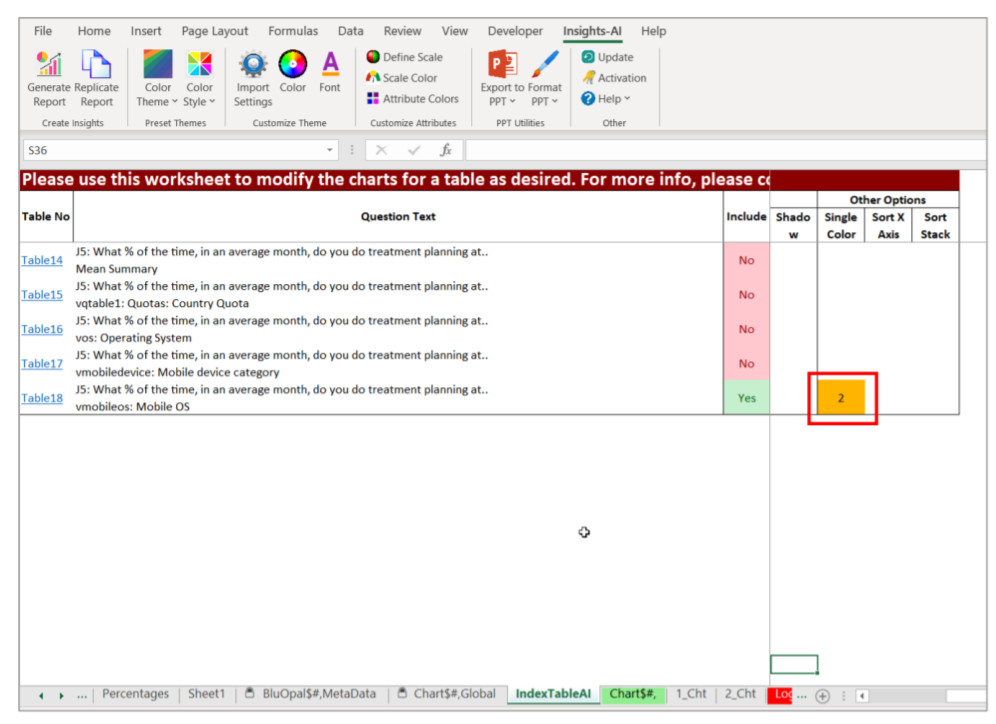
You need to include the desired table and exclude all others in the Index table. Below is a sample.
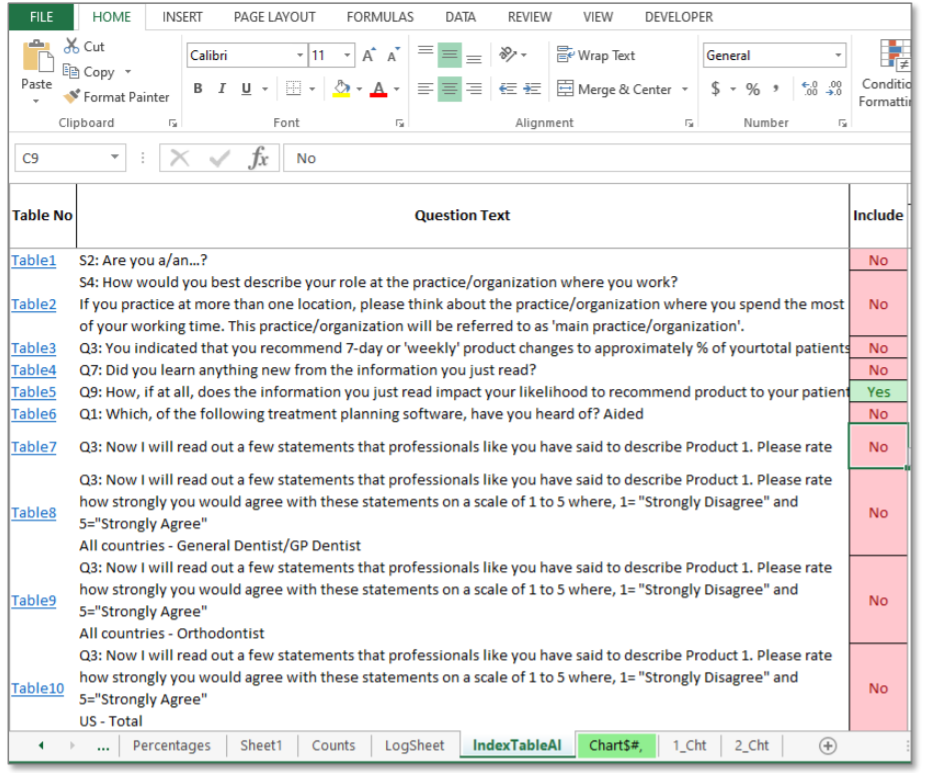
Now, click on the “Generate” button to see the charts in Excel where you can do the customization. Do remember, when you select only one table, the tool moves into “customization” mode, which means the chart will NOT be exported to PowerPoint automatically. You can export the customized charts by clicking on the “Export to PPT” button on the Addin ribbon or by clicking on the “PPT” button of the individual chart.
When I select only one table in the index, the charts are not exported to PowerPoint. Why?
When you select only one table in the index, the tool moves into “customization” mode, where it facilitates the customization of all charts corresponding to the selected table. Hence, the chart will NOT be exported to PowerPoint automatically. You can export the customized charts by clicking on the “Export to PPT” button on the Addin ribbon or by clicking on the “PPT” button of the individual chart.
I want to make a custom table with data from multiple tables. Can I do this in the tool?
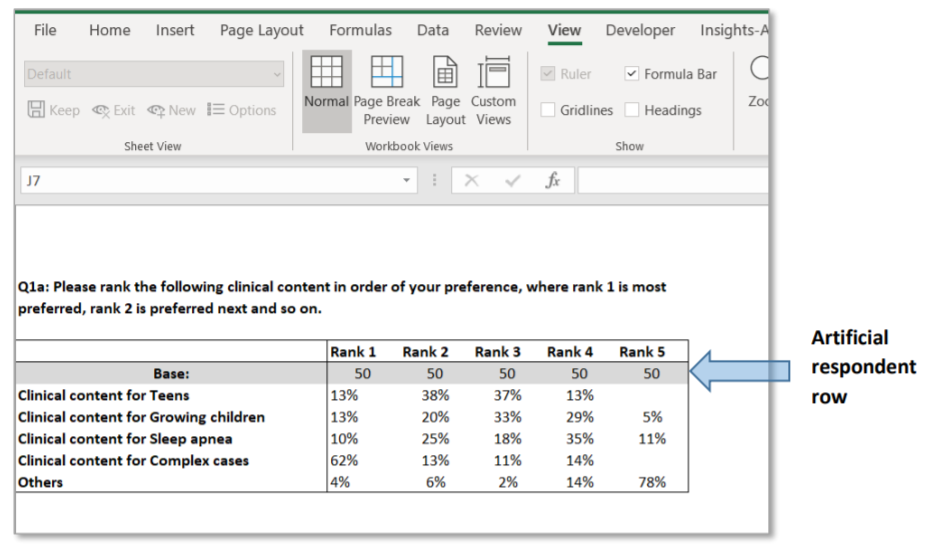
Yes, you can create charts for custom tables. Please create the custom table in a NEW Excel workbook, save it and click on the “Generate” button.
Please remember that the tool only identifies a table if it has a “Respondent” row. So, if your custom table does not have a respondent row, please create an artificial one with the same number of respondents. When the number of respondents is the same for all banners, the tool creates a separate text box to show the respondent number, which you can easily delete in PowerPoint.
If you are still facing a problem, please consult the “Data-tables’ Best Practices” section of the operating manual.
Please remember that with a paid project, Insights-AI provides a few free custom table analyses. However, if you conduct too many custom table analyses, the tool may ask you for your PIN.
The tool appears to leave some tables and charts during the full generation process. Why?
Yes, the tool leaves a few tables and charts in certain tables when many charts are selected. When the Insights-AI application generates a report for the first time, it attempts to generate charts corresponding to all of the tables. However, based on an algorithm, it may leave some tables by indicating “No” in the “Include” column in the Index table. Also, the application may not generate all of the charts for a table during full report generation to manage the number of charts generated. For example, if the base size is small, it may leave that chart during full report generation.
You can always generate excluded tables or charts by manually selecting “Yes” under “Include Column” When you generate charts for only one table, the application generates all of the charts corresponding to that table.
The tool has placed the charts at undesired locations on the slide, or the layout of slides generated is undesired.
The tool copies the last slide of the template and places the chart on that slide. Hence, it is essential that the PPT has at least one slide in it. Also, since the last slide is copied, that slide should have the “Title and Content” or “Full Content” layout so that the maximum area of the slide is available for the charts.
For adding a “Title and Content” or “Full Content” slide, go to Home > New Slide and then select the required layout.
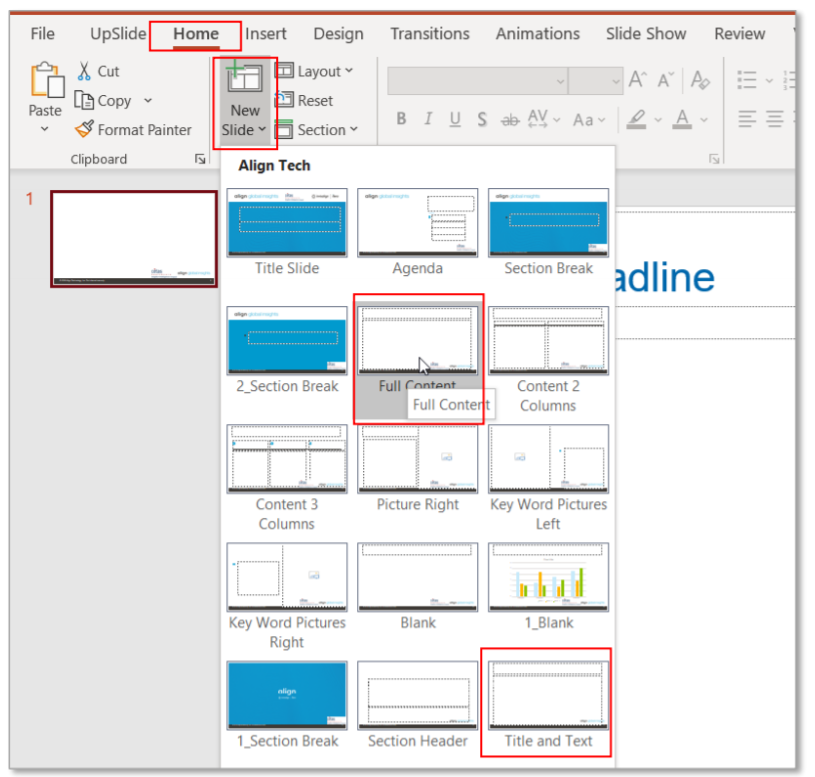
How do I add a slide with the “Full Content” or “Title and Content” layout?
For adding a “Title and Content” or “Full Content” slide, go to Home > New Slide and then select the required layout.
4. Color and Font Customization
How do I create a multi-chart bar type with different shades of the same color?
When you create a multi-chart bar type in the tool, the application allows you how to set the single-color for multiple charts or how to follow the color theme of the project.
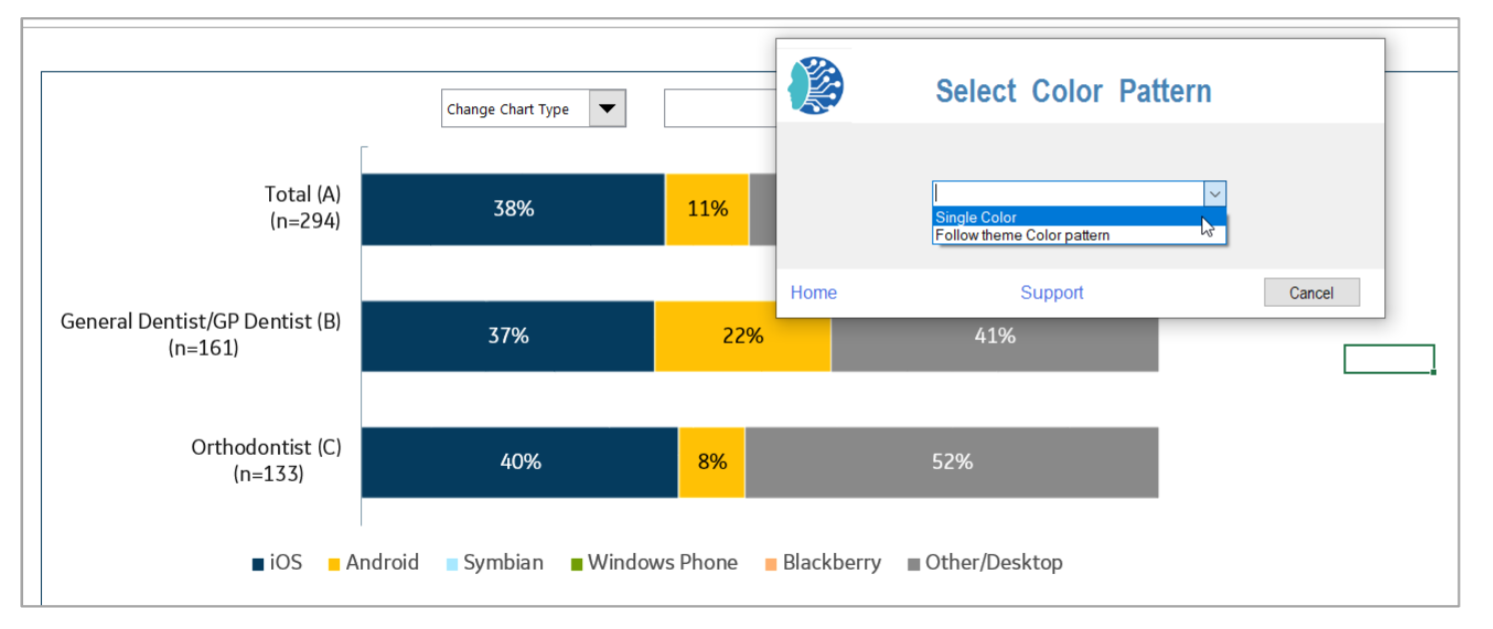
If you select “Single Color,” the tool creates all the charts in the shade of the first color.
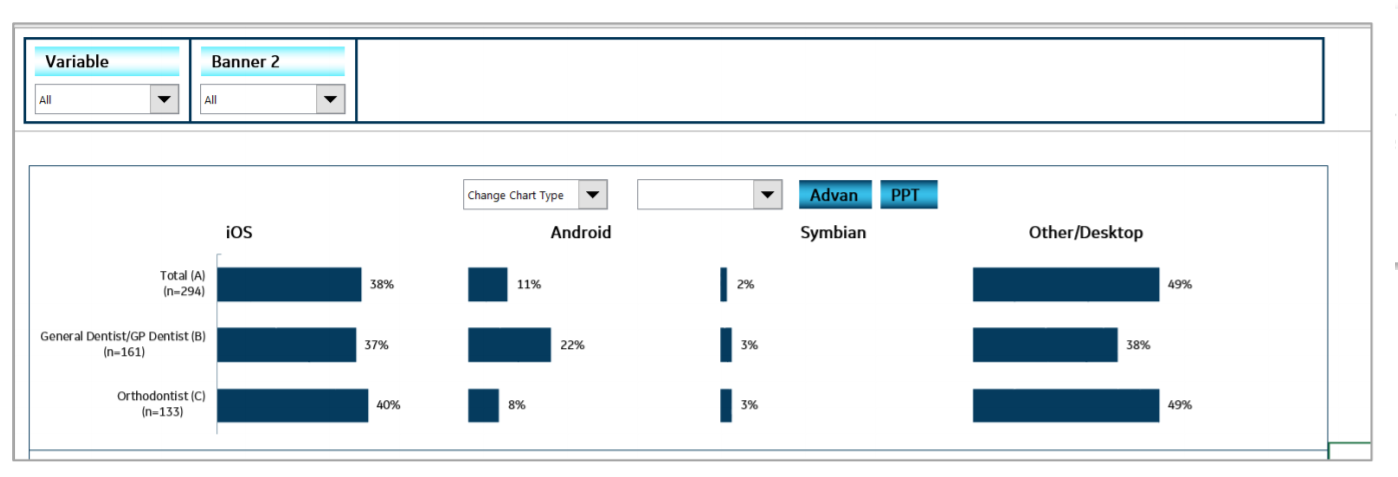
For creating charts in different shades of a single color, you first need to utilize the “Single Color” setting provided in the Index table. Select the color whose shades you want to apply from the theme.
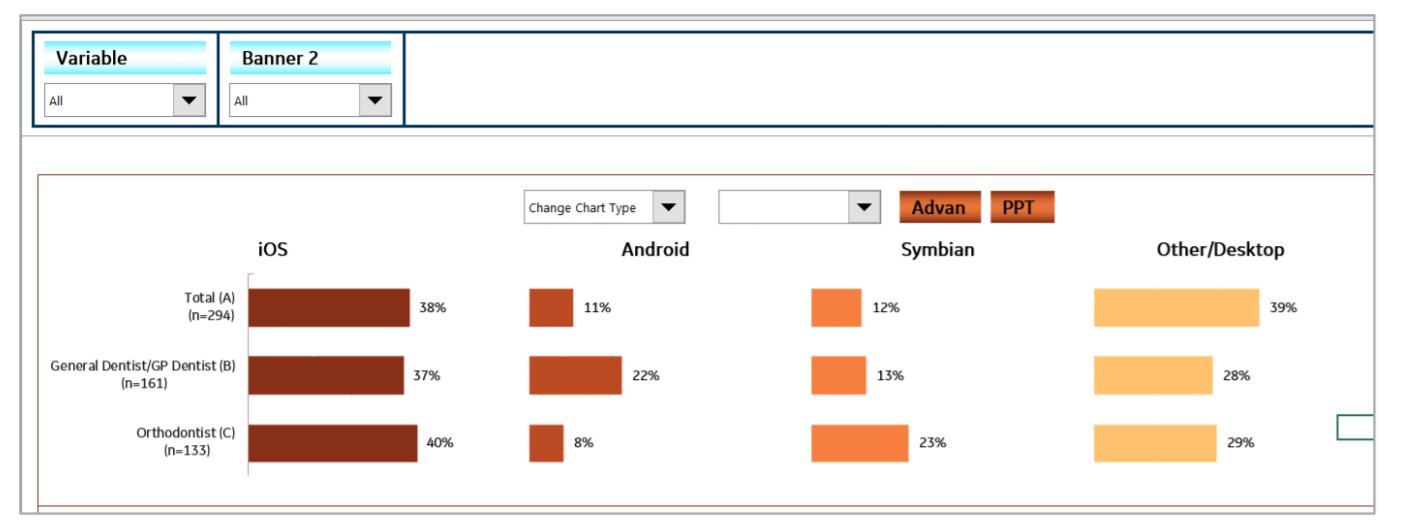
Then, generate the multi-chart bar type and apply the “Follow theme color pattern.” The tool will generate the chart in different shades of the selected color in the Index table.
The desired font is not available in the dropdown menu. How can I set this font?
If the font you are looking to apply is not in the default list of windows, it may be a customized font. In general, you will get an installer for the font online. Please download and install the font on your system. Then close all the open Excel files and open it again. Now you should be able to see the desired font in the dropdown menu.
5. Issues in Chart Display
The tool has sorted the data in the display. How can we remove the sorting of the data?
Please consult the operating manual, which covers this topic in detail. The tutorial video also covers this briefly.
The tool has clubbed a few points as Others. How can we remove this grouping as others?
Please consult the operating manual, which covers this topic in detail. The tutorial video also covers this briefly.
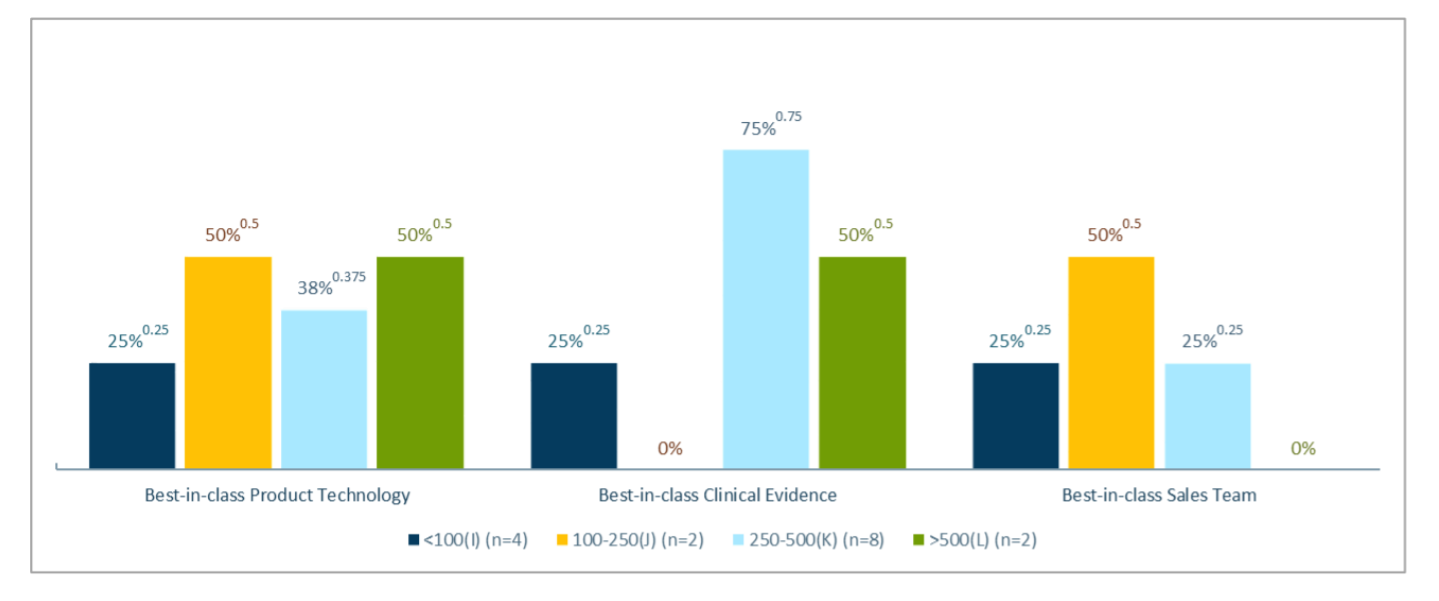
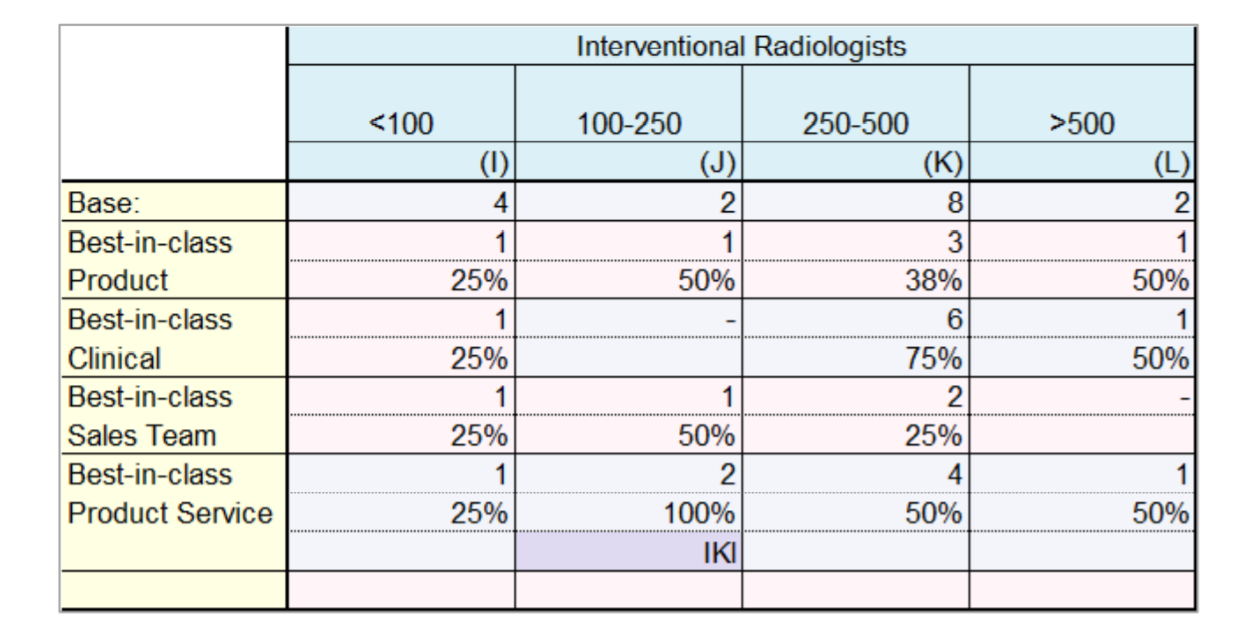
The data-labels are repeated as significance test results as shown.
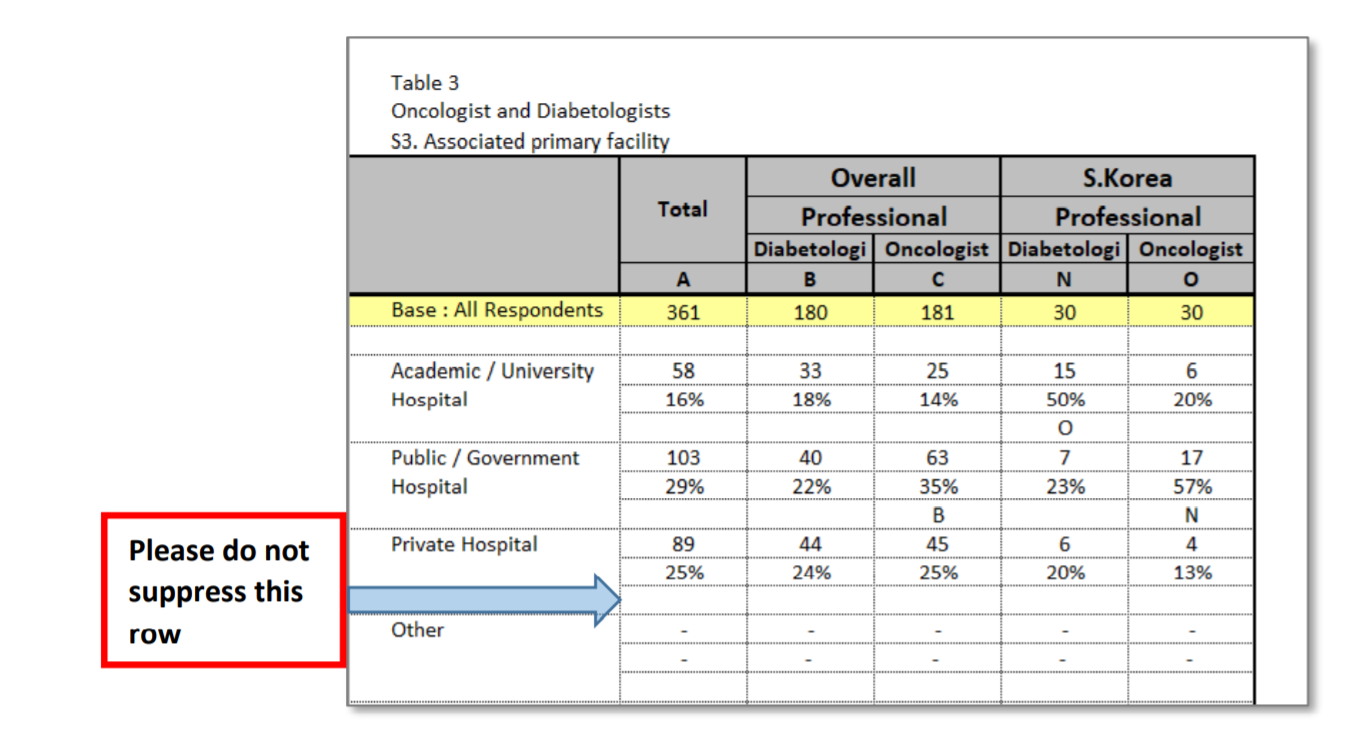
If the table is showing multiple information like count, proportion, and significance testing results, please do not suppress the rows/columns containing no information (i.e. all the entries are blank).
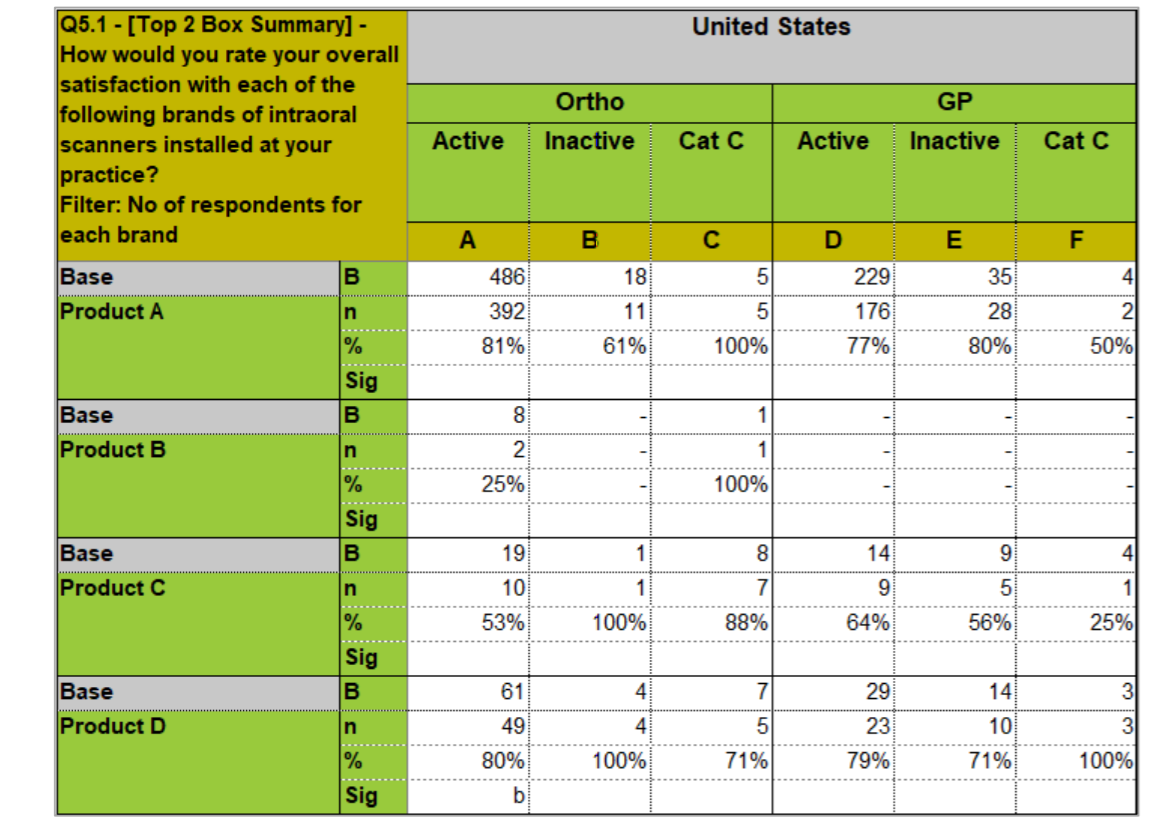
The unusual display of significance test results happens when some of these rows are suppressed, like in the example below. All the variables have significance test results displaying rows removed except Best-in-class Product Service. This creates errors. In these cases, the tool may skip some problematic rows in the chart.
6. Customizing Brand / Scale Colors
How do I create a multi-chart bar type with different shades of the same color?
Please consult the “Color and Font Customization” section of this FAQ page.
7. PowerPoint relate issues
The tool has placed the charts at undesired places on the slides, or the layout of slides generated is undesired.
The tool copies the last slide of the template and places the chart on that slide. Hence the PPT must have at least one slide in it. Also, since the last slide is copied, the last slide should be the “Title and Content” or “Full Content” layout so that the maximum area of the slides is available for the charts.
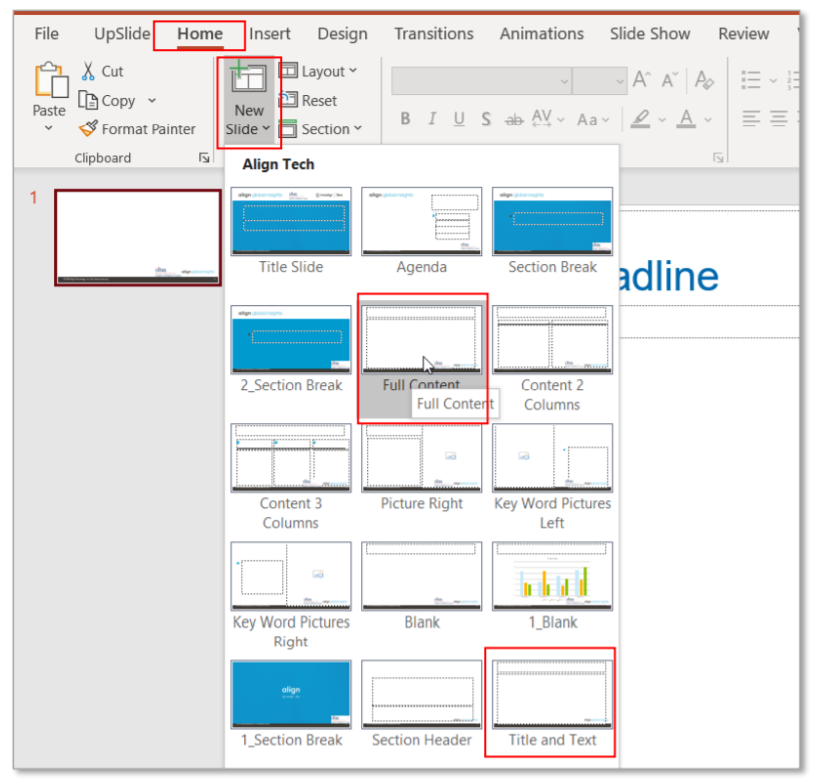
For adding a “Title and Content” or “Full Content” slide, go to Home > New Slide and then select the required layout.
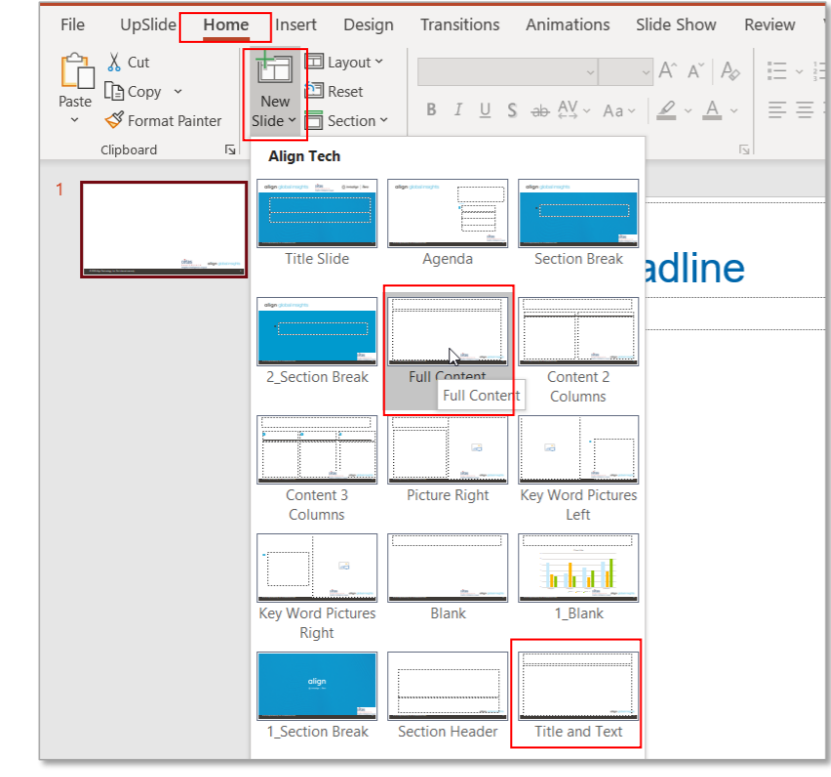
How can I add a slide with a “Full Content” or “Title and Content” layout?
For adding a “Title and Content” or “Full Content” slide, go to Home > New Slide and then select the required layout.
8. Managing PIN and Online Account
9. Data-tables’ Best Practices
I have different respondent numbers for each row of variables, but it is not displaying correctly on the chart.
Please ensure that each respondent row has “Base:” in the leftmost field. In the example below, it is “Base.” So it may cause an error in some cases. Changing “Base” to “Base:” resolves all issues.
